

This second post (see the introduction regarding DDMRP) will describe the way buffer level are calculated. Indeed, we will here deep dive into some variables and setup mandatory to provide the correct level of buffer for each DDMRP item. You may be aware of the Min/Max approach used with the traditional MRP. When the coverage code used is Min/Max, the MRP generate planned order any time the Min is reached to fulfill until the Max. With DDMRP, a new level is introduced: the Reorder Point, between Min and Max. Any time the Reorder Point (ROP) is reached, the engine will generate a planned order to fulfill the Max minus the Net Flow value (we will see this Net Flow concept later on). So what is following here are the KPI available to be able to calculate the Min / ROP / Max value.
Average daily Usage (ADU)
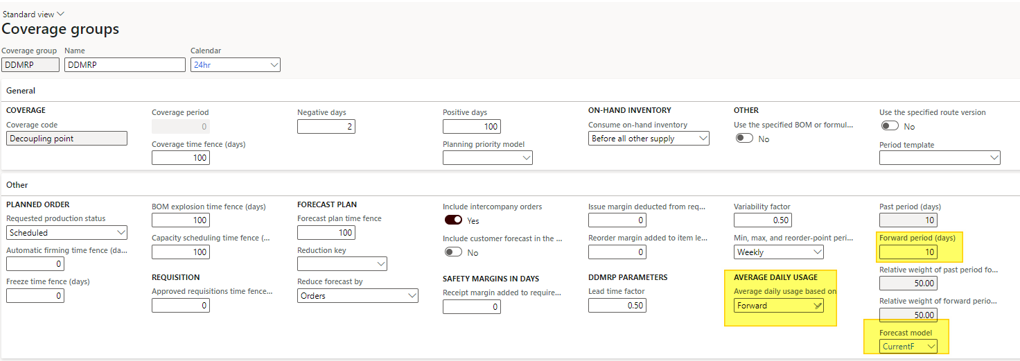
This value aims to identify the average consumption for the item. From the coverage group, you will define the way you want this KPI to be calculated. By choosing Forward for “Average daily usage based on”, the engine will analyse the next “Forward period” in days setup.
Don’t forget to associate the correct Forecast model.
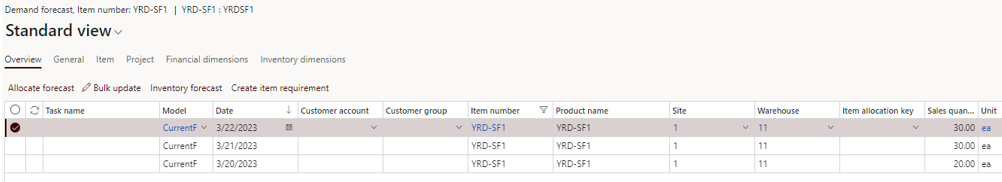
Then, the system will have a look on the forecast setup. In my example, I’ve put 3 days of forecast for a quantity of 20, 30 and 30.
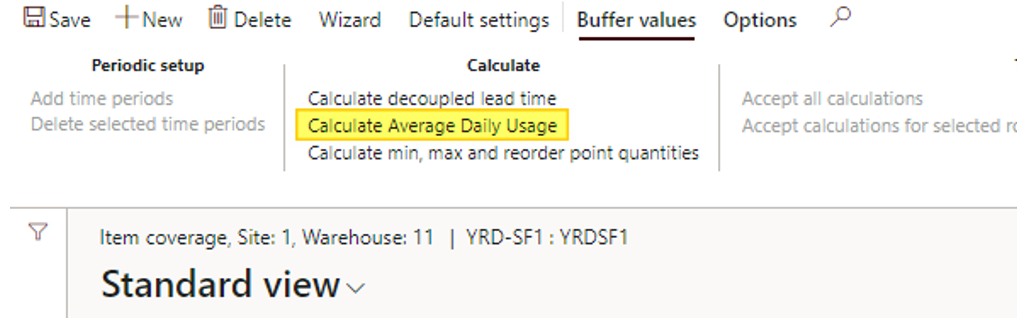
From the item coverage, I ran the “Calculate Average Daily Usage” button.
The system has update the Average Daily Usage with 8. Note that you can update it manually any time.
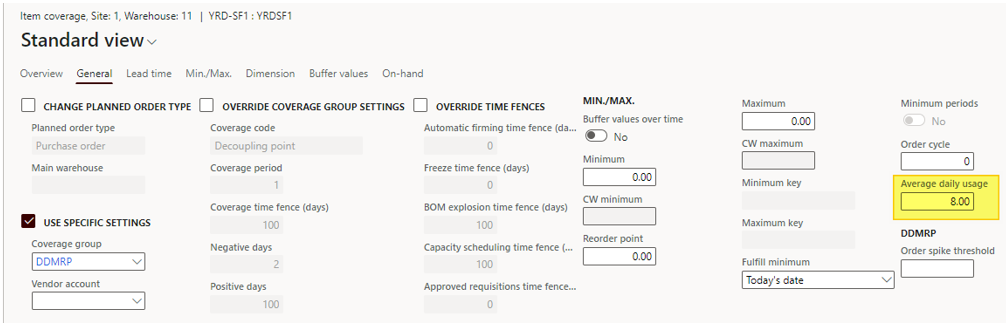
The explanation is the following : (30 + 20 + 20) / 10 = 8
- Numerator : sum of the forecast across the Forward period days
- Denominator : Forward period days
There is two other methods for calculation the Average Daily Usage : Backward (with a Past period day to setup) and Blended (mix between past and future).
You can also apply a weight for the post period and the forward period with the last 2 setup available on the coverage group. See the definition :
- weight of past period for blended average daily usage – Enter the weight (as a percentage) to apply to the past period when the blended ADU is calculated. This setting applies only when the Average daily usage based on field is set to Blended
- Relative weight of forward period for blended average daily usage – Enter the weight (as a percentage) to apply to the forward period when the blended ADU is calculated. This setting applies only when the Average daily usage based on field is set to Blended.
Zone calculation factor
There is also 2 zone calculation factors which are available on the coverage group and impacts the Min / ROP / Max values.
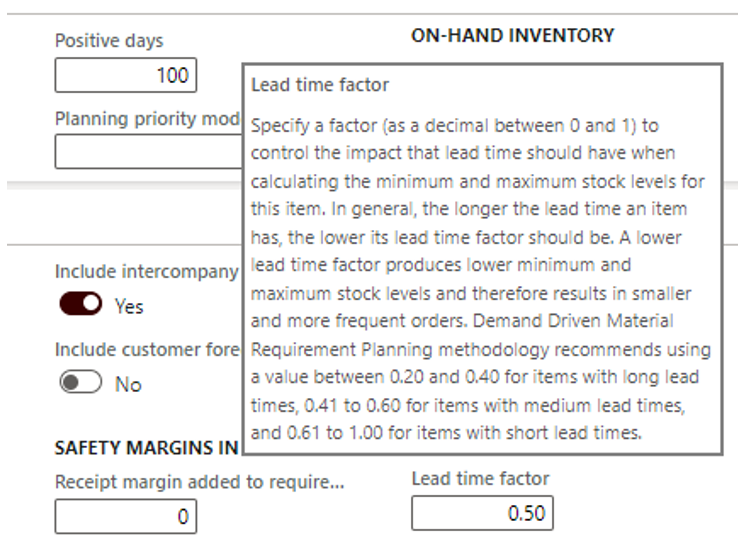
Lead time factor
The lead time factor weights the Min / Max calculation taking into account the lead times setup. As you can see on the definition below, for items with long lead times, you should put a a shorter value.
The value should be between 0 and 1 and some recommendation are written by Microsoft as you can see :
- Value between 0,2 and 0,4 for items with long lead times
- Value between 0,41 and 0,6 for medium lead times
- Value between 0,61 and 1 for short lead times
What is short, and what is long ? It depends on your appreciation for it. So, for my demo, I’ve chosen to let it at medium with 0,5.
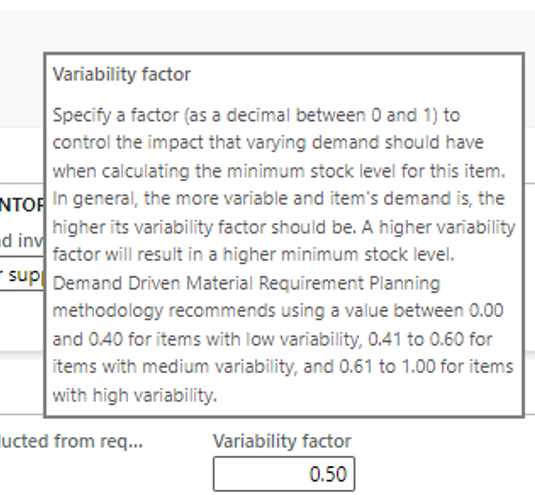
Variability factor
The Variability Factor is also available on the coverage group and weights the calcul depending on how much the demand is varying. Same as previous Microsoft suggests to put the Variability Factor with values between 0 and 1 according to :
- between 0 and 0,4 if the variability is low
- between 0,41 and 0,6 if the variability is medium
- between 0,1 and 1 if the variability is high
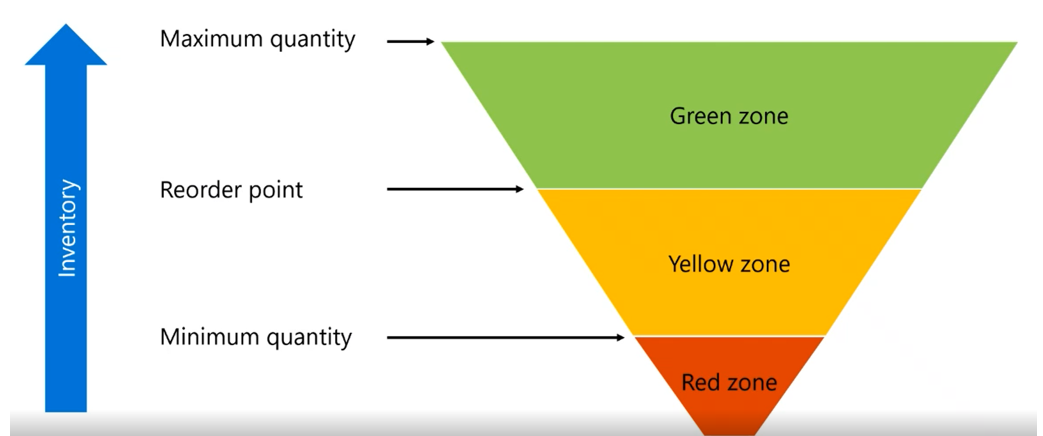
Min/Max/Reorder point calcul
For understanding the calcul, you need to be familiar with color zone. Let’s have a look on the definition :
- Red zone– The area below the minimum quantity. The minimum quantity is also referred to as « top of red, » and your planning strategy should be designed to ensure that stock levels are always above this point.
- Yellow zone– The area between the minimum quantity and the reorder point. The reorder point is also referred to as « top of yellow ». When this point is reached, the system should reorder.
- Green zone– The area between the reorder point and the maximum quantity. The maximum quantity is also referred to as « top of green ». This point is the maximum level that the stock will be replenished to.
Source Tech Talk
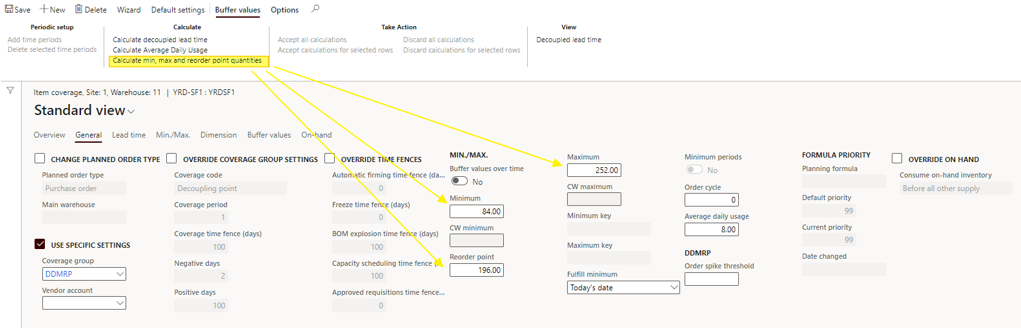
So let’s calculate the Red Zone with my demo sample for the SF1 product:
See the formula here:
- Red base= ADU × Decoupled lead time × Lead time factor
- Red safety= Red base × Variability factor
- Red zone= Red base + Red safety
Red base = 8 (ADU) x 14 (Decoupled Lead Time) x 0,5 (Lead time factor) = 56
Red safety = 56 (Red base) x 0.5 (Variability factor) = 28
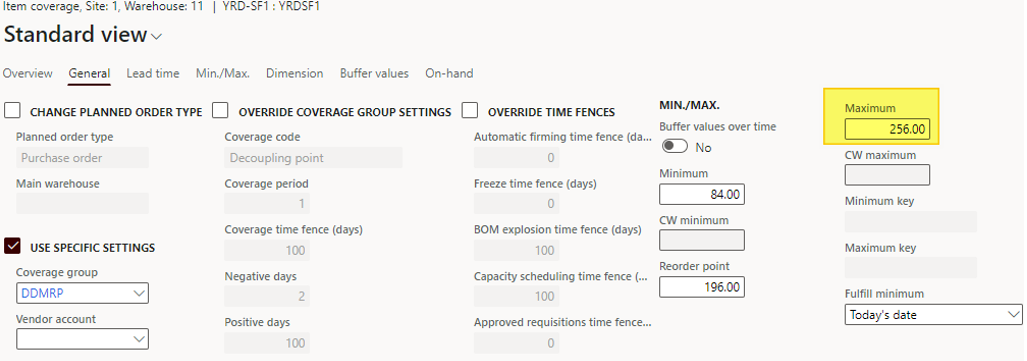
Red zone = 56 (Red base) + 28 (Red safety) = 84
That’s how the minimum is defined !
- Yellow zone= Average daily usage (ADU) × Decoupled lead time
For the SF1 product, the result is : 8 (ADU) x 14 (Decoupled lead time) = 112
It generally fits with the expected consumption during replenishment lead time.
That’s how the Reorder point is calculated = Min + Yellow zone = 84 + 112 = 196
- Green zone: Max of
- Minimum order quantity = 0
- ADU × Order cycle = 8 * 0 = 0
- ADU × Decoupled lead time × Lead time factor = 8 * 14 * 0.5 = 56
For SF1, the Green value is then 56.
The Max is calculated as follow = Reorder point + Green value = 196 + 56 = 252
A quick focus on the Order cycle. It aims to setup a frequency in days between placing 2 purchase orders (if existing constraints). For instance, I cannot place an order every day so I put 2 days for order cycle. The limitation is that it applies for all the suppliers as it has to be setup on the item coverage.
Just running another quick test by adding a min order quantity under de Default order setting form of the item, to see if the Green value is updated.
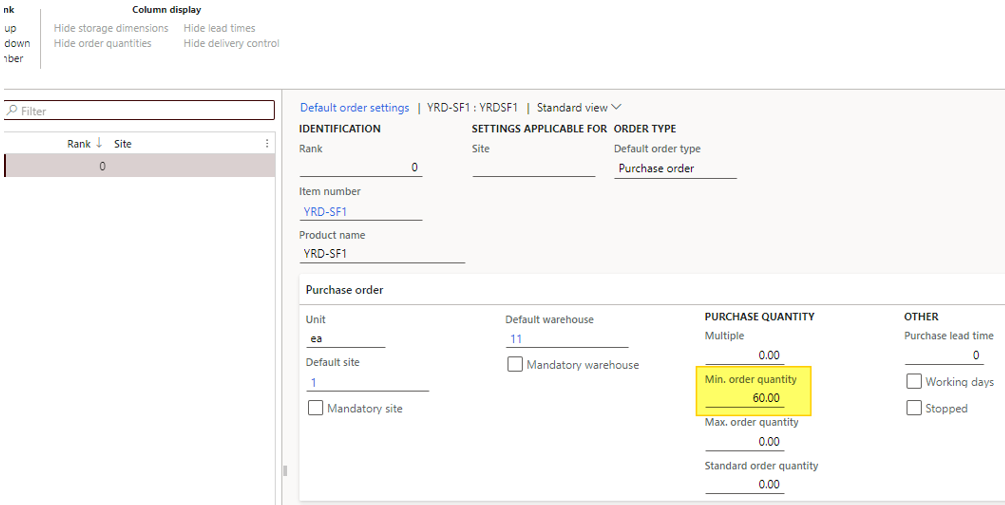
Indeed, by running the calculation the Maximum has been updated from 252 to 256 as the Max of the formula for defining the Green value is now 60 instead of 56
- Minimum order quantity = 60
- ADU × Order cycle = 8 * 0 = 0
- ADU × Decoupled lead time × Lead time factor = 8 * 14 * 0.5 = 56
For SF1, the Green value is then 60.
The Max is calculated as follow = Reorder point + Green value = 196 + 60 = 256
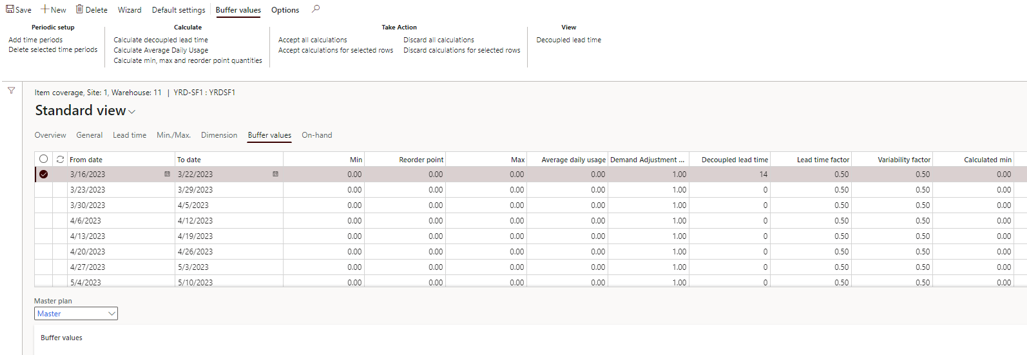
From the Master planning module, under the DDRMP menu item, you can automatically (and batch it) run the buffer level Calcul
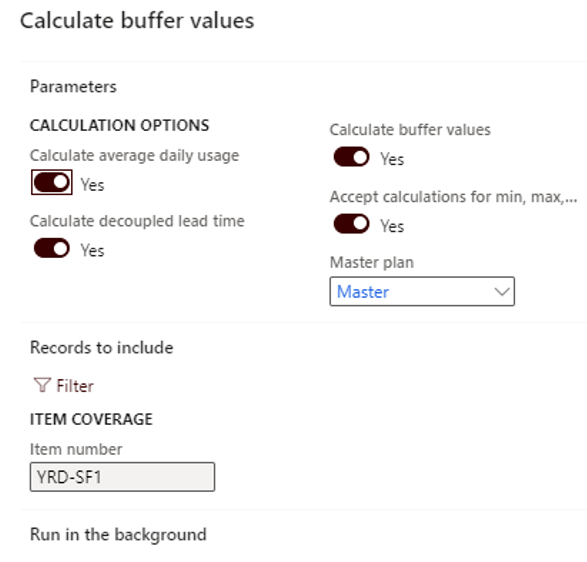
You can filter on items, and choose either to initialize all the KPI or some of them. Going back to the item coverage, the buffer values tab has been generated, according the setup of the coverage group (weekly or daily interval). We will deep dive this feature in the next post.
That’s it for the second step with DDMRP. It’s not done yet !
Yohann
Additional resource: