

In this post, I will detail how calculated emissions have an impact on analytics (views) available out of the box of Sustainability Manager and give insights to stakeholders.
The impact of every calculation is visible on the available reports from the Analytics view of Sustainability Manager as long as there is any emission generated.
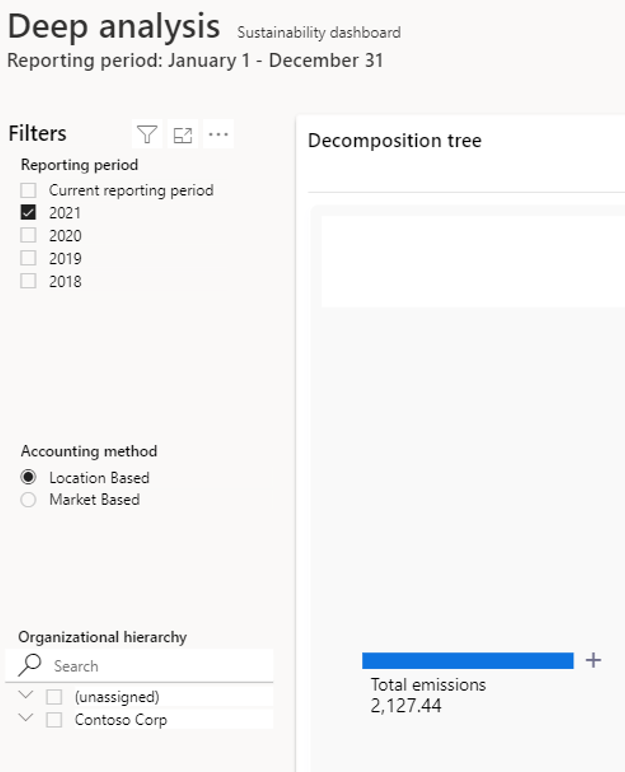
For this scenario, I’m looking at the 2021 total emission which is 2 127 (assuming MTCO2 Eq).
I’m filling a huge quantity of Analytical data with appropriate criteria and the running an existing calculation profil, in this case Mobile combustion.

When it’s done, you can retrieve the result of the calculation under the All emissions form.
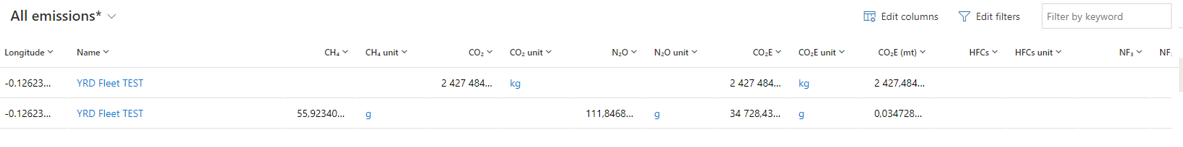
As you can see, the amount of Co2, N2O and CO2E is quite significative for having a visible impact on the Power BI report.
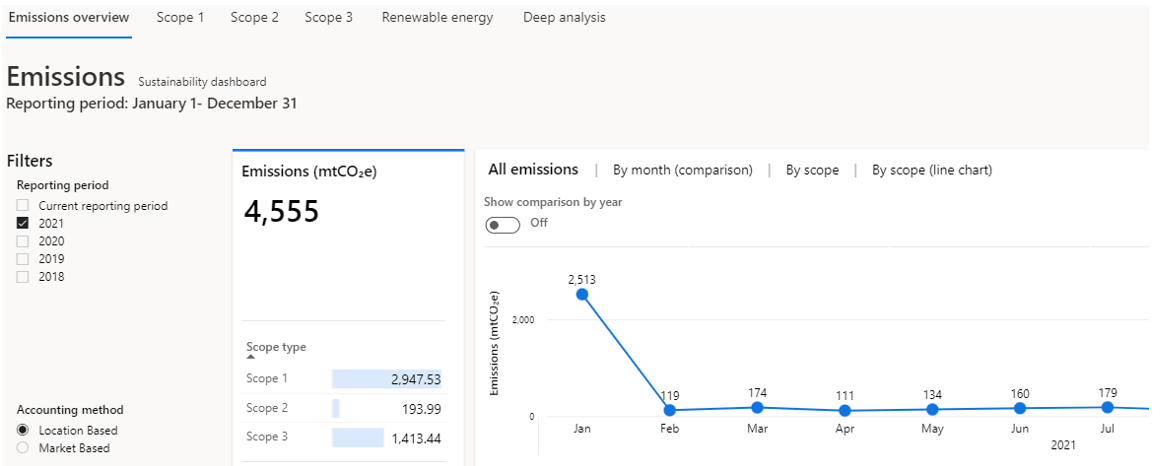
Waiting for the next Power BI refresh (I haven’t see where or if it’s possible to setup the frequency of the refresh, maybe it’s because I’m running a trial demo environment) and running the same report :
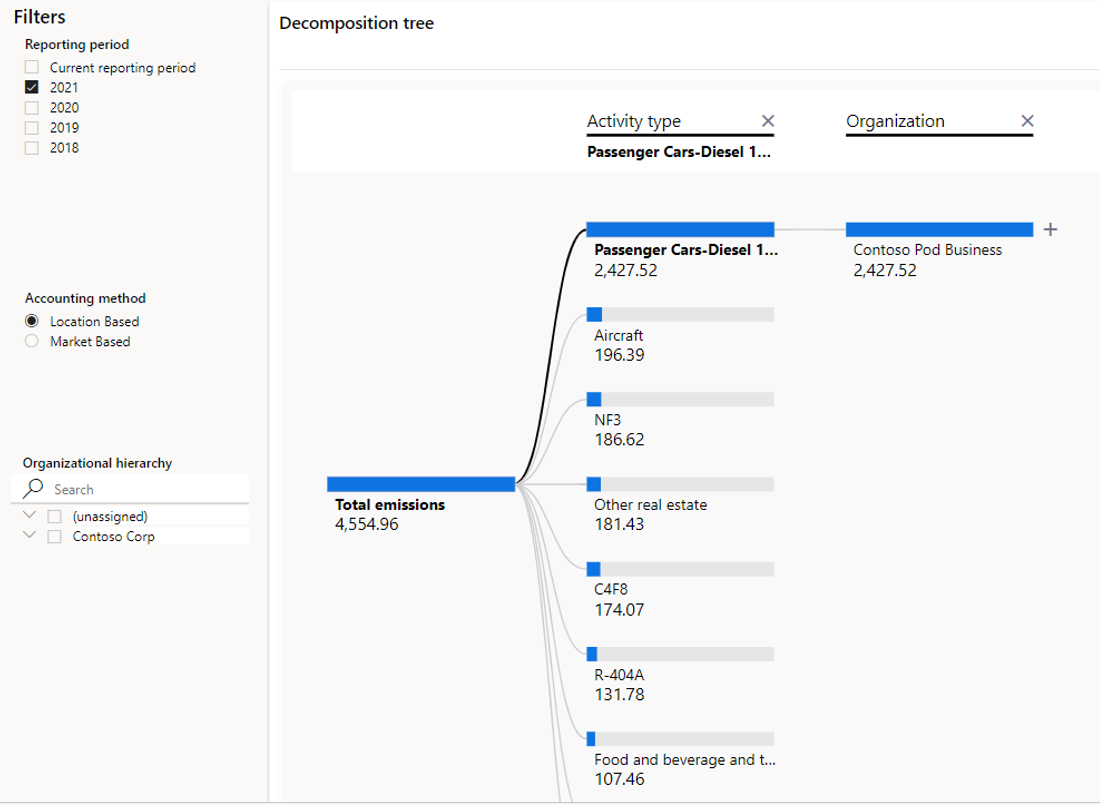
Much more emissions especially on January which fit with my Analytic import.
That’s it for this data calculation process process. It’s not that complicated when you have understood the wording (factors, calculation,…).
Yet, I haven’t be able to update the Power BI (for instance filter on periods). I will deploy a real environment and not a demo one to check all the features.
If you wish to see the previous posts on the same topic, please refer to the key concepts, or Data Ingestion, or even Data Calculation.
Yohann