

Today I will focus on probably the best workspace ever build by Microsoft product teams within Microsoft Dynamics for Supply Chain Management (in my opinion of course). The Supply chain risk assessment helps you analyse the supplier quality rate and procurement risk related to OTIF indicators.
What’s OTIF ? On Time In Full : “On time in full (OTIF) is a supply chain metric that is calculated by multiplying fill rate by on time. When perfect fill rate and perfect on time are used at the order level, this perfect OTIF meets the perfect order definition. »
Basically it will check every Purchase order line and indicates for each of it if it has been fully delivered and in time. In this workspace you can analyse shortages and delays.
Let’s see how it’s retrieved.
Requirement and setup
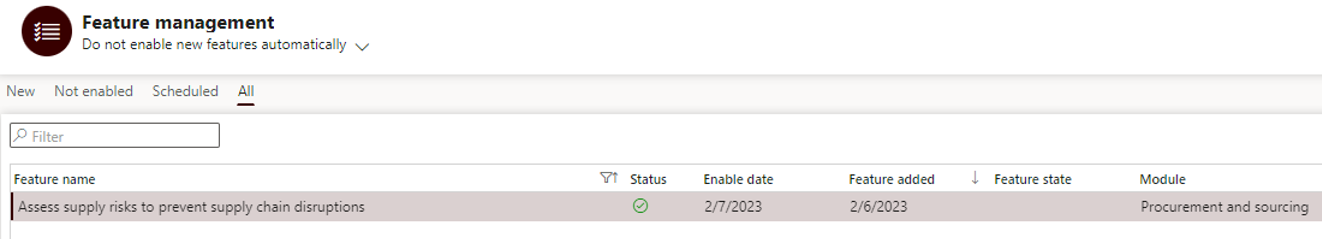
Available since PU31, the “Assess supply risks to prevent supply chain disruptions” feature has to be enabled for activating the new dashboard.
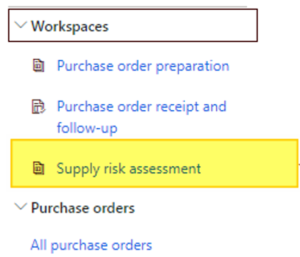
Then, you will find the Supply Risk Assessment workspace under the workspace list or from Procurement module.
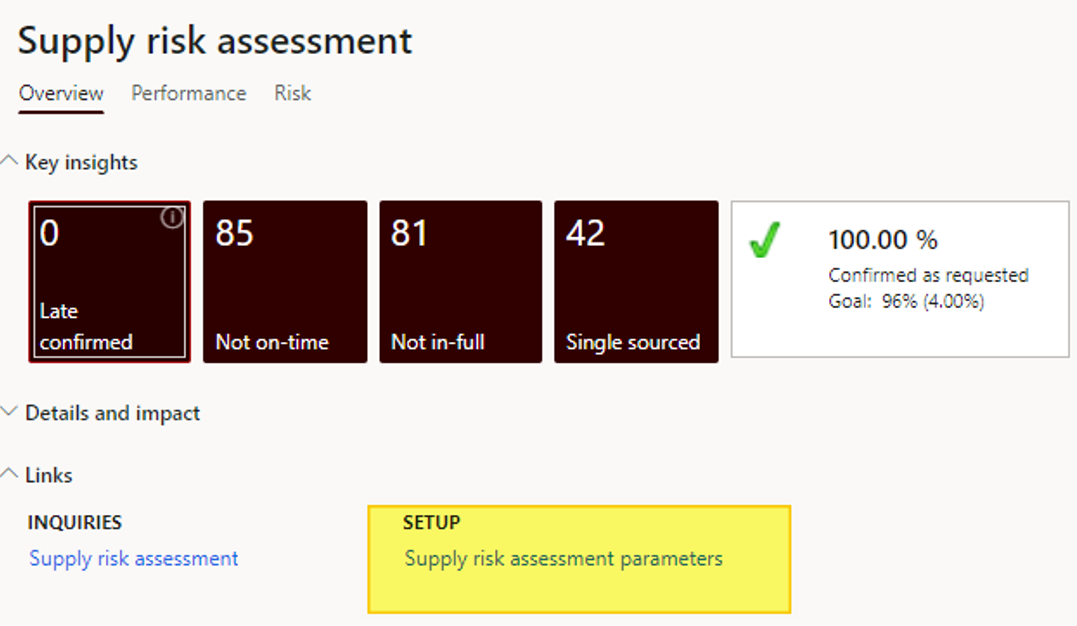
This workspace comes with a form for setting it up.
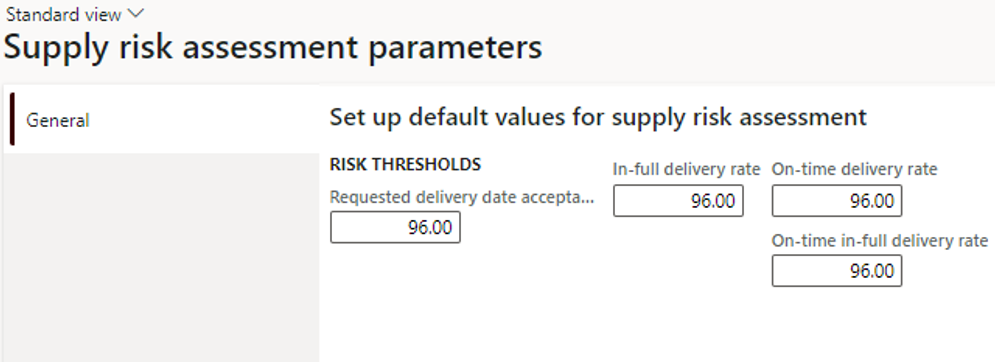
You can put different threshold which will be displayed later on. Here I put every one of them to 96% for the demo purpose.
For refreshing data there is 2 things to consider:
1/ use the Data refresh status for a quick update and take into account new orders within embedded D365 views
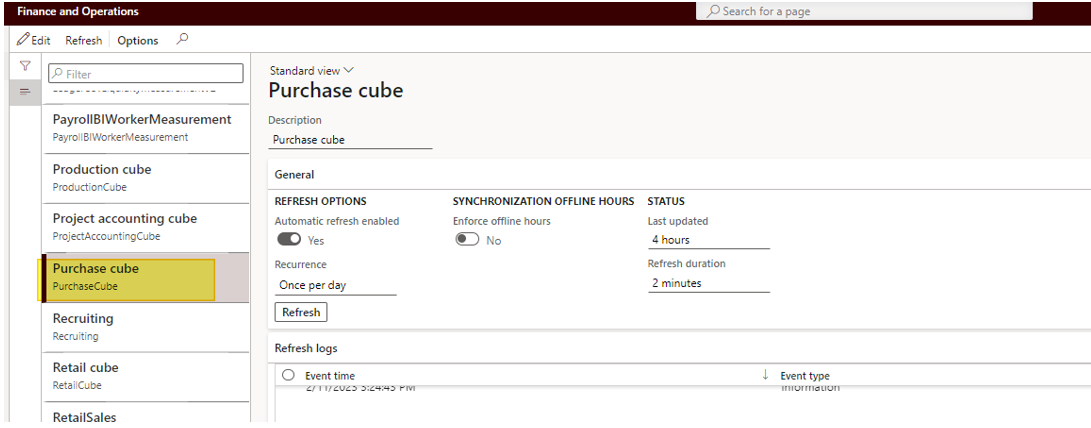
2/ Setup the refresh of the Entity cube, especially the Purchase cube. Data available within embedded Power BI reports (see Performance and Risk) are part of BI cube and need to be refreshed automatically or manually. Go under System administration > Setup > Entity Store and don’t forget to refresh your data.
Next, it’s time to discover this new workspace : three main sections : Overview, Performance and Risk.
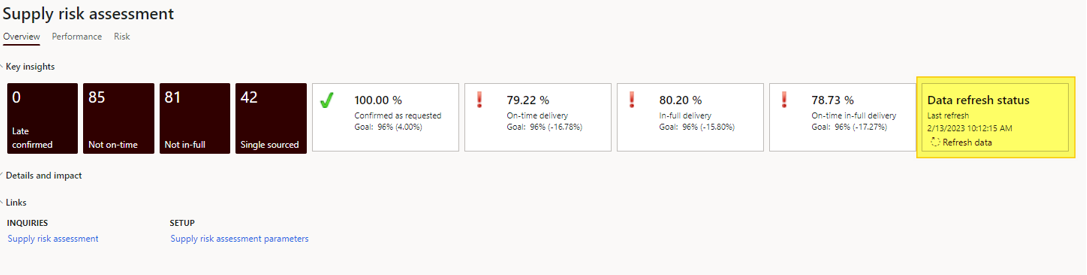
Overview
As you can see, you have some tiles (Late Confirmed, Not on-time, Not in-full, Single sourced). As usual with workspaces, when you open it you will retrieve the whole list of associated purchased orders within the current company.
Not on-time overview with my sample tests:
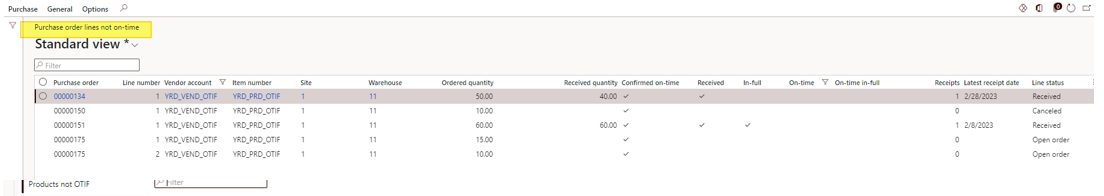
Not in-full overview with my sample test:
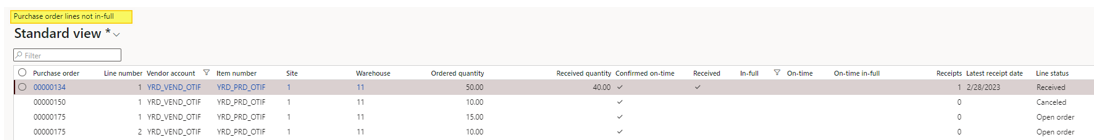
One tiny difference between the 2 views : the purchase order 151 have been fully received.
Note that when you create a new purchase order it will appears in the 2 lists because as created it’s not yet received.
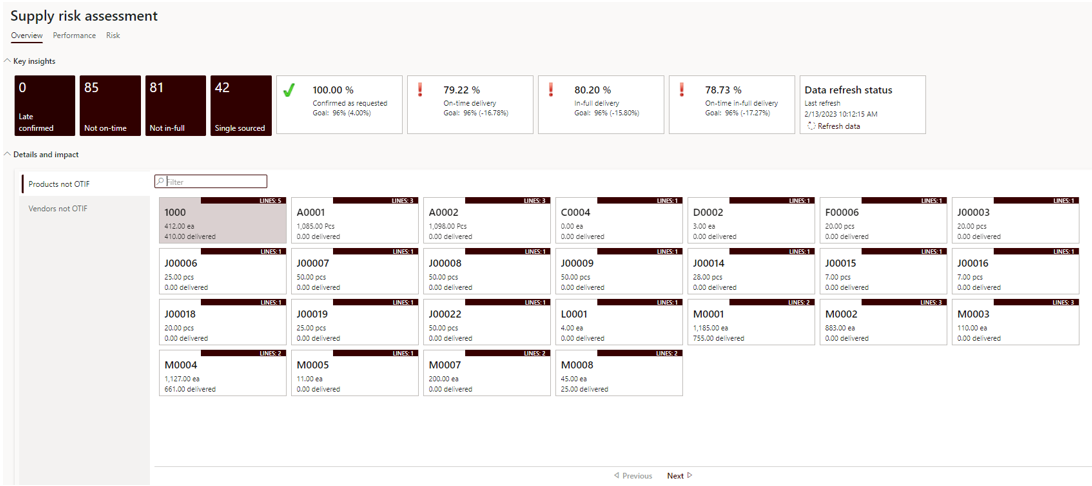
The “Details and impact” views offers you the same view sorted by items or vendors. There is a useful Previous and Next button on the bottom of the form.
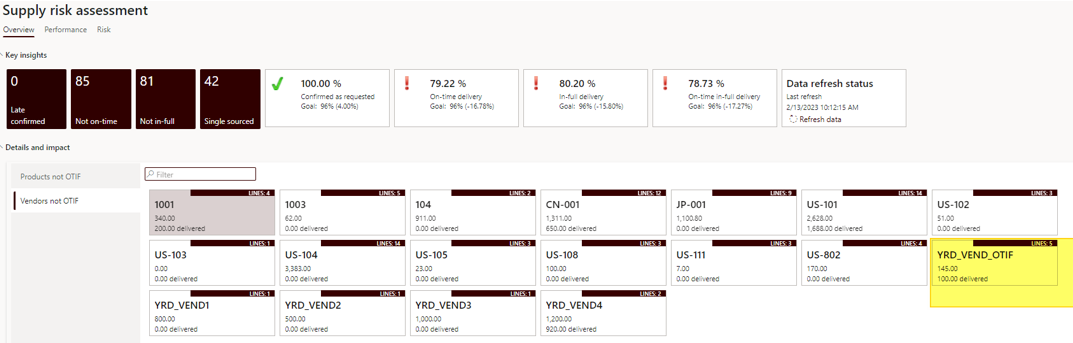
There is an overview of total ordered quantity (145) and total received quantity so far (100) on the button.
Orders fully delivered in time does not appears on this workspaces (when they have been received of course) and are not part of the KPI calculation here.
On the top of the overview section you will find the OTIF KPI but only for the current entity, which is different for the 2 other sections.
A clic on “Data refresh status” is enough for updating any data here, when a new purchase order line is updated.
Performance
A wonderful Power BI is available from 3 tabs (Supplier, Product, global OTIF analysis which gather the 2 previous views). For updating this one you will need to refresh the Purchase cube entity store.
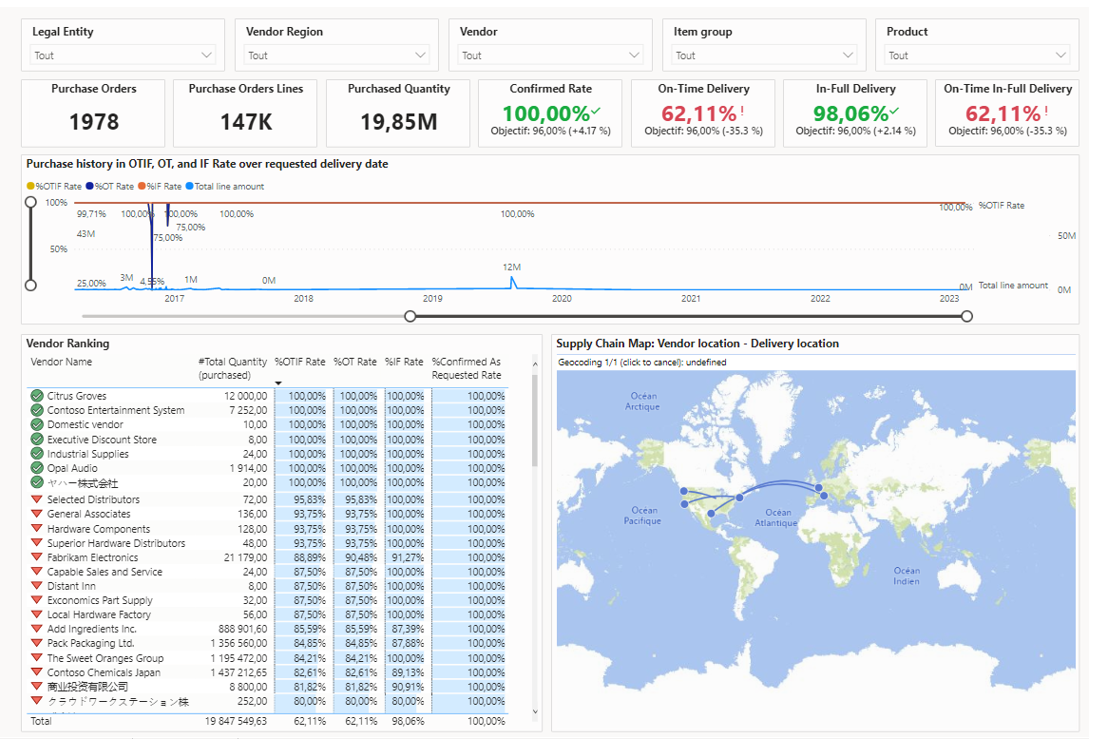
As you can see on the top, 5 filters are available and you can notice that this cube is cross-company designed.
Filtering on my sample test is easier to understand :
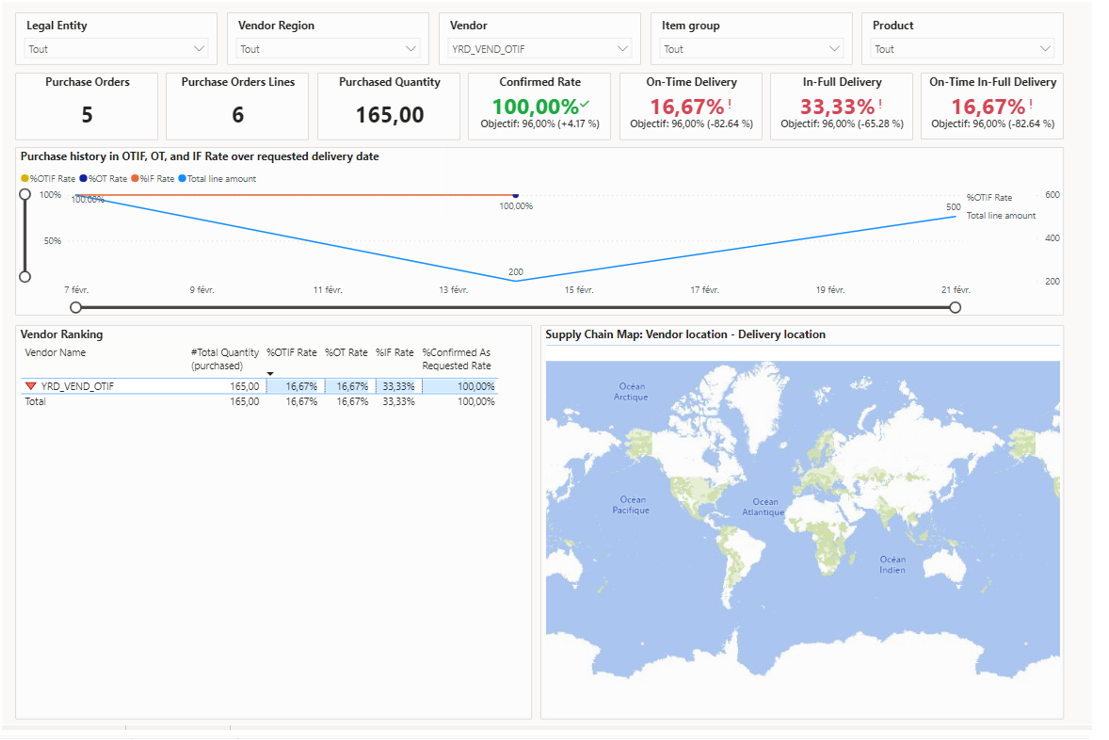
5 Purchase orders are visible and 6 Purchase orders lines for a total quantity ordered of 165 :
- 1 line / 6 on-time, so 16.67%
- 2 lines / 6 delivered in-full, so 33.33%
- 1 line / 6 on-time in-full, so 16.67%
Have in mind that new orders only filled are taken into account here and make the rates decreased (wrongly on my opinion as those orders are note “late” so far).
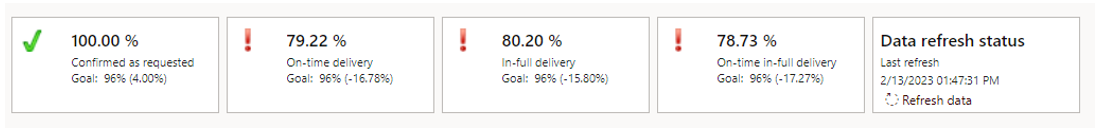
On the KPI displayed you can notice the thresholds setup on the workspace setup form.
The graph below indicates the purchase history and highlight the main KPI %OTIF Rate, %OT (On time) Rate, % IF (In Full) Rate and Total Line in amount.
I haven’t setup any address on my supplier sample that’s why nothing is displayed on the map.
Risk
Risk section is useful when you have some planned purchase orders created according to a Master Plan. This cube will helps you identify risk and prevent shortage on future orders.
You have 4 tabs which displayed the risk in different views : Planned Purchase Risk, Sourcing Risk Analysis, Purchase vs planned orders, Planned supply flow
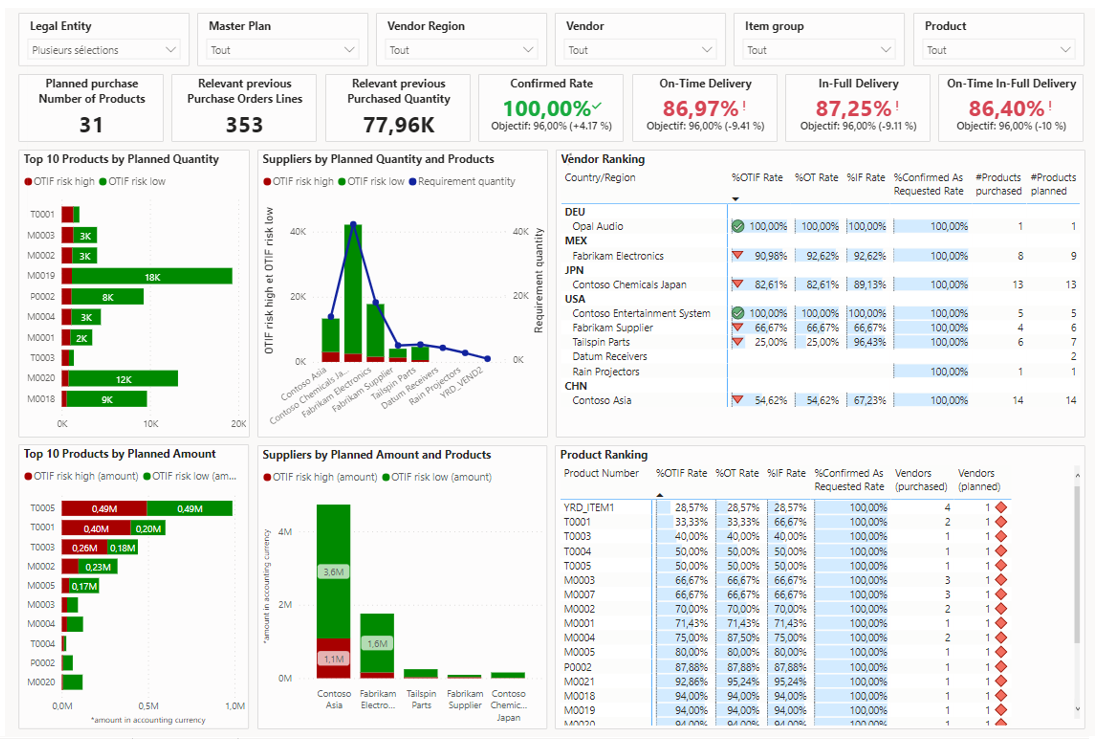
Below is the Planned Purchase Risk view, which displays several dashboards : Top 10 Products by planned quantity and amount, and 2 histograms sorted by supplier. Also available a Vendor and product ranking according to OTIF Rate.
The Sourcing Risk Analysis displays every order with the required and at risk quantity.
The Purchase vs. planned orders focused on the planned orders vs WIP purchase orders (view per product quantity, in amount, etc).
The Planned supply flow add some information regarding the source and target city of the purchase orders, and also the Delivery method associated with the OTIF rate.
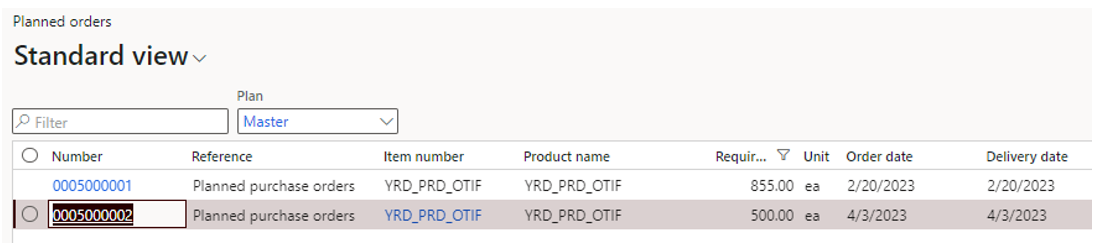
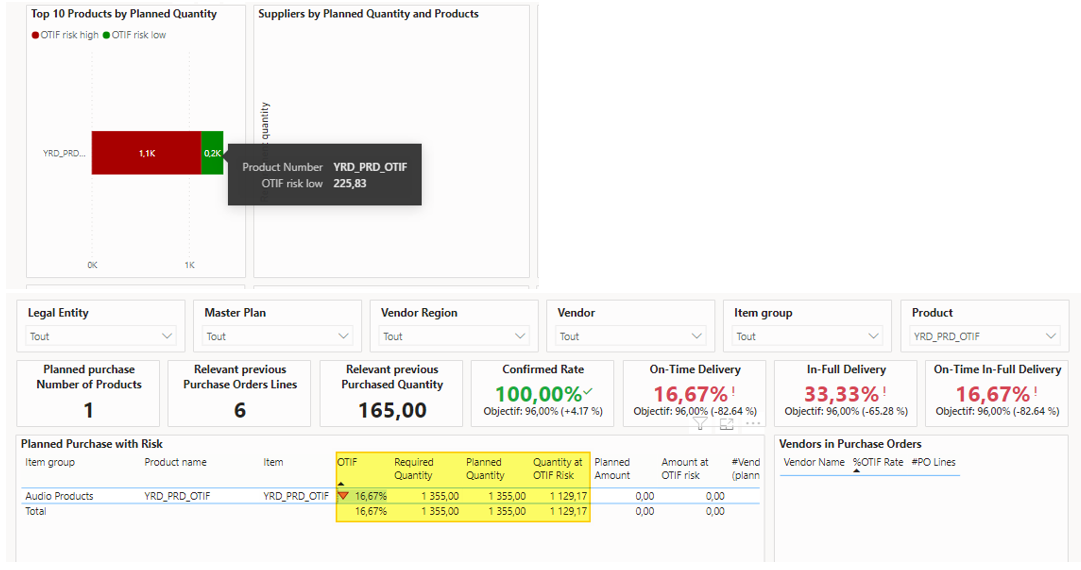
In my sample test I have a planned purchase order requirement of a quantity of 1355 for my product.
As the OTIF rate is 16.67%, the planned quantity at risk is calculated accordingly (ie : 1355 * 0.1667 = 226 not at risk for delivery; -> 1129 at risk for delivery)
Conclusion
The Supply Risk Assessment workspace is a very helpful tool with a lot of KPI and dashboard for the procurement team. It’s a real improvement for taking appropriate actions for reducing shortage and delays.
Yohann
Additional documentation:
One comment